Friday, October 17, 2008

Scatterplot Map


A scatterplot is a graph where two data values for an individual in a dataset are used to plot a point in two dimensional space. The result is a scattering of points. A scatterplot is useful for visually determining the correlation between two variables, or finding distinct clusters of individuals in the dataset.

Infrared Aerial Photo Map


This picture depicts what an infrared satellite photograh looks like. It shows clouds and their temperatures by way of bright colors. This is helpful in viewing hurricanes and other types of weather.

DLG Map


Digital Line Graphs (DLGs) are digital vector representations of cartographic information derived from USGS maps and related sources.

Proportional Map


By applying a formula to control the area of circles and then applying precise expansion factors, students create proportional circle maps in which the circle area reflects some attribute value. Numerical and proportional data on each U.S. state whow that the formula was applied correctly. A vector graphics program is used.

Statistical Map of the Brain


The glass brain view is intended to provide a visualization for statistical group analysis results but can also be used for individual data. In the glass brain view, the functional clusters of a statistical map are represented and visualized as shaded polygon meshes in a transparently rendered Talairach brain.

Thursday, October 9, 2008

Climograph Map


A climograph is a graphical representation of the monthly precipitation and temperature conditions for a specific region. Precipitation is shown by the bar graph and a line graph depicts temperature.

Wind Rose Map


A wind rose is a graphical tool utilized by meteorologists to depict how wind speed and direction are distributed at a specific location. It will show the frequency of winds blowing from certain directions. Each concentric circle stands for a different frequency which starts at zero in the center and increases in frequency in the outer circles.

Triangular Plot


A triangular plot displays information in a shape of a triangle. For example here is a triangular plot of election votes.

Parallel Coordinate Graph


Multivariate relations are obtained through the use of these graphs. Specific properties of the relationship correspond to the geometrical properties of the graph.

Star Plot Mop


Star plot is a graphical data analysis method used for examining the relative behavior of all variables in a multivariate data set. Here is a star plot of crime rates in the United States.

Isotach Map


Isotachs are lines on a given surface connecting points with equal wind speeds. The are seen sometimes in conjunction with isobars.

Isohyet Map


An isohyet is a line joining points of equal precipitation on a map. A map with isohyets is called an isohyetal map.

Unclassed Choropleth Map


This technique assigns shadings proportional to the data values so that these choropleth maps do not have to classify the data. This method of mapping has not been generally accepted because many cartographers claim that they lose the ability to direct the message of communication.

Bivariate Choropleth Map


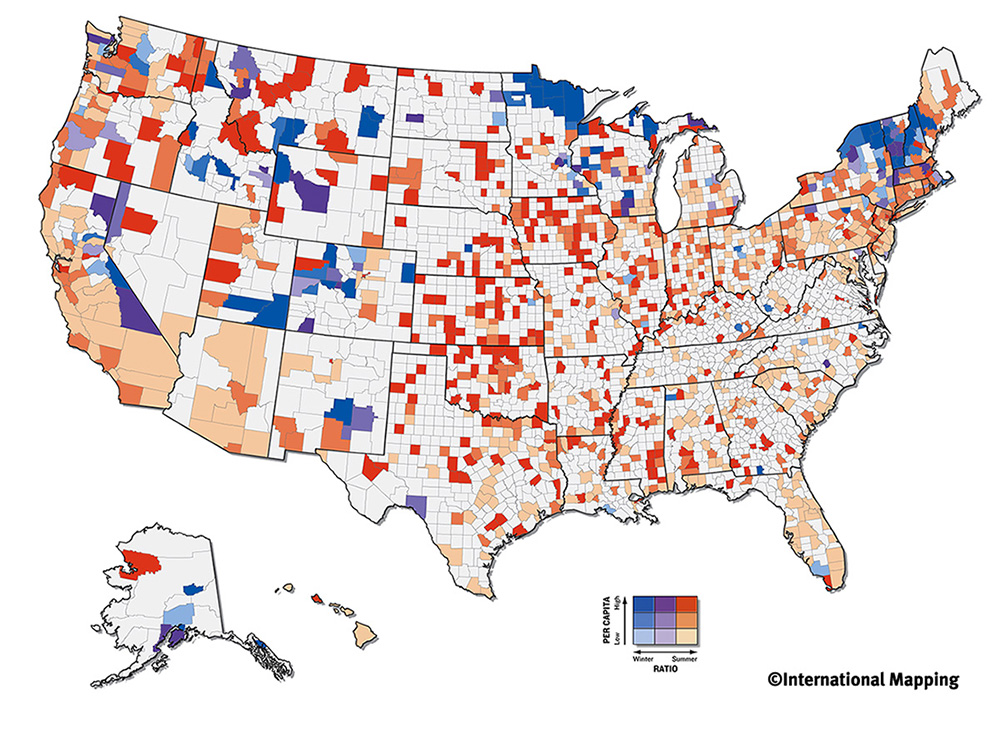
Bivariate choropleth maps display two different variables displayed on one map by including two different sets of graphic symbols or colors. Here is a map depicting olympic athletes. You can see how this type of map can solve spatial problems.


Cartographic Animation


Cartographic animation has become a useful technique for representing geographical area's because of its capablilites to show relations between geospatial data's components, location, attribute, and time. They are typically used to display geospacial information. The goal of cartographic animation is to be able to visualize somethign that would not be seen if the maps were looked at individually.

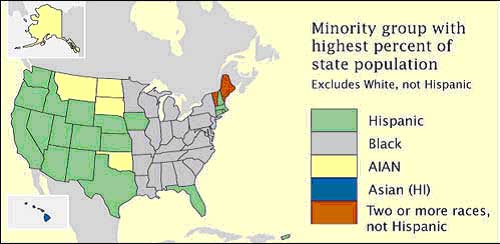
Nominal Area Choropleth Map


Nominal area choropleth map is a choropleth map that is used to dispaly nominal data. Here is a map with nominal data showing which state's minority group has highest percentage of state population.

Lidar Map of New Orleans


Light Detection and Ranging (LIDAR) is a remote sensing system used to collect topographic data. This technology is being used by the National Oceanic and Atmospheric Administration (NOAA) and NASA scientists to document topographic changes along shorelines. These data are collected with aircraft-mounted lasers capable of recording elevation measurements at a rate of 2,000 to 5,000 pulses per second and have a vertical precision of 15 centimeters (6 inches).

Isopleth Map


Provides a useful way to visualize continous data that has been broken down into classes. Lines are drawn to connect all points of a certain value and a user can interpret the value of any place by its proximity to these lines. This kind of maps are often used when ecountering environmental data.

Thematic Map


Thematic maps are used to display geographical concepts such as density, distribution, relative magnitudes, gradients, spatial relationships and movements. Also called geographic, special purpose, distribution, parametric, or planimetric maps. These types of maps are sometimes referred to as graphic essays that portray spatial variations and interrelationships of geographical distributions.